//Rethinking Vulnerability Scoring
General | Art Chaisiriwatanasai | 1. December, 2008
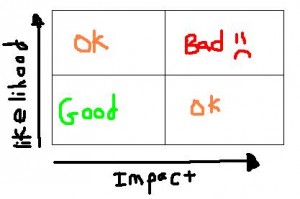
When a vulnerability is identified within an organization, how is its risk measured? One popular method is to assess likelihood vs impact. Numbers are assigned to both factors and plotted on a heat matrix (shown below).
In case you haven’t already guessed, any vulnerabilities that are plotted in the first quadrant are rated as high severity, which are given first priority for remediation. Quadrants two and four are ranked as medium risk, while the third are low and last in the queue. There are a couple flaws with this method. First, it is very, very difficult for a person to consistently assign ratings to vulnerabilities in relation to each other. So many environmental variables exist that could cause the rating to fluctuate that you either end up over-or-under-thinking its value. Instead of a scatter plot of dots, you’d almost need a bubble surrounding each point indicating error margin. Although not entirely arbitrary, its probably the next best thing to it. Secondly, since only two factors are involved, likelihood and impact are boiled up into very high level thought processes instead of calculated, consistent valuations. As the graph shows, there are only three possible risk rankings: high, medium, and low. This leads the assessor to become complacent and risk averse, by placing most vulnerabilities in the “medium” severity quadrants.
The solution? Enter CERT’s Vulnerability Response Decision Assistance (VRDA) Framework. They have published a proposal for further refining the process of vulnerability prioritization, as well as possible courses of action. Each vulnerability is given a value through a pre-defined set of criteria, or as CERT calls them, “facts”. To summarize:
Vulnerability Facts
- Security Product – Does the vulnerability affect a security product (Yes/No)
- Network Infrastructure Product – Does the vulnerability affect a network infrastructure product? (Yes/No)
- Multiple Vendors – Does the vulnerability affect multiple vendors? (Yes/No)
- Impact 1 – What is the general level of impact of the vulnerability on a system? (Low, Low-Medium, Medium-High, High)
- Impact 2 – What are the levels of impact for confidentiality, integrity, and
availability of the vulnerability on a system? (Low, Low-Medium, Medium-High,
High) - Access Required – What access is required by an attacker to be able to exploit the
vulnerability? (Routed, Non-routed, Local, Physical) - Authentication – What level of authentication is required by an attacker to be able
to exploit the vulnerability? (None, Limited, Standard, Privileged) - Actions Required – What actions by non-attackers are required for an attacker to
exploit the vulnerability? (None, Simple, Complex) - Technical Difficulty – What degree of technical difficulty does an attacker face in
order to exploit the vulnerability? (Low, Low-Medium, Medium-High, High)
World Facts
- Public Attention – What amount of public attention is the vulnerability receiving?
(None, Low, Low-Medium, Medium-High, High)
- Quality of Public Information – What is the quality of public information available
about the vulnerability? (Unacceptable, Acceptable, High)
- Exploit Activity – What level of exploit or attack activity exists? (None, Exploit
exists, Low activity, High activity).
- Report Source – What person or group reported the vulnerability?
Constituency Facts
- Population – What is the population of vulnerable systems within the
constituency? (None, Low, Low-Medium, Medium-High, High)
- Population Importance – How important are the vulnerable systems within the
constituency? (Low, Low-Medium, Medium-High, High)
Although some of these facts I feel are irrelevant, this improves upon original methods greatly. The most obvious is that there are not only more criteria to evaluate, but they are consistent and specific. Also, you will notice that none of these have the standard low-medium-high ratings. The article explains that this was purposeful, as to “reduce the tendency of analysts to select the median ‘safe’ value”.
The article also presents a decision tree for actions items after you have performed your scoring. Although I won’t go into great lengths here, I think it is a novel concept and something that should be developed further. Every organization will need to sit down and plan their own, as models will vary by industry and size.

Comments